Crypto indicators are used to predict how the price of Bitcoin and other cryptocurrencies will move. Crypto indicators rely on trends and technical analysis, overlaying data onto trading charts to help traders make smarter investment decisions. Although Bitcoin and other crypto indicators never offer perfect information, they can provide a helpful picture of what buyers and sellers are likely to do next.
If you want to earn a nice bonus and also save money every time you shop online, here’s how:
- Sign up with TopCashback, a cashback portal currently offering a $15 signup bonus that’s extremely easy to get.
- The average TopCashback user saves $450/year, with savings of up to 30% on fashion, 40% on cosmetics and beauty, 50% on travel, and much more.
What Are The Best Indicators For Crypto Trading?
1. Moving Average Convergence/Divergence (MACD)
The MACD, also known as the moving average convergence/divergence (MACD), is a widely used indicator for cryptocurrency trading. Its popularity is largely due to its ease of use and its ability to provide strong crypto trading signals.
The MACD is a trend-following indicator that assesses whether the short-term price momentum is following the long-term price momentum, and if not, it’s used to determine if a trend change is on the way. The MACD has four elements: the MACD line, signal line, zero line, and histogram.
To construct the MACD line, subtract the 26-EMA from the 12-EMA. The EMAs are used in place of MAs to improve sensitivity to trend changes and price momentum.
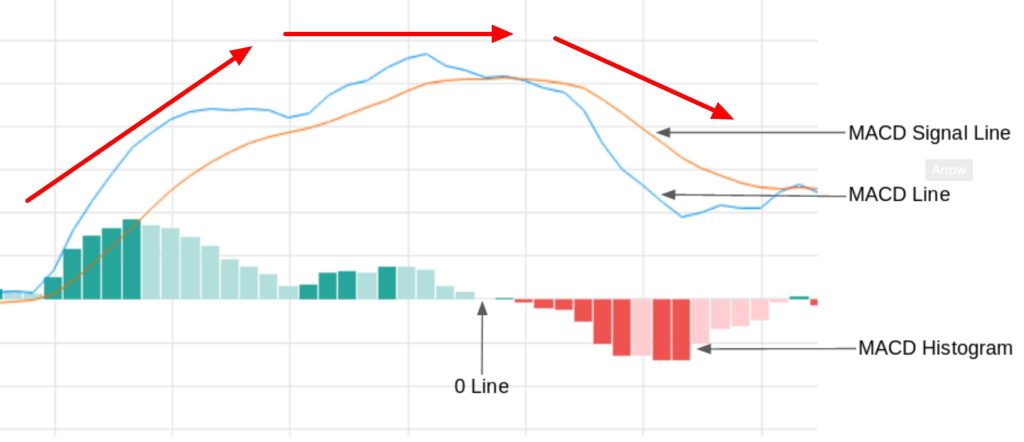
When the signal line is combined with the MACD line, as they converge, diverge and cross, it becomes the basis for many trading signals.
The MACD line is at zero when the zero line is reached. Both the 26- and 12-period EMA are at this level.
The MACD histogram displays the MACD line’s distance from the signal line. It may be positive when the MACD line is above the signal line or negative when the signal line is above the MACD.
Here’s a video that explains more about MACD and some of the other indicators in this post:
The MACD isn’t like other Bitcoin indicators in that it lacks an absolute range; thus, it’s not suitable for determining oversold and overbought situations.
When two oscillating lines cross, the following are some of the MACD common trading signals you may create:
- Bullish: where the MACD crosses above the signal line
- Bearish: where the signal line crosses above the MACD line.
Because these crossovers occur all the time, you could receive a lot of false positives.
As a result, rather than using these signals alone to generate trading decisions, it’s better to integrate them with others to enhance your results.
If both the MACD line and signal line rise at the same time, this is considered a bullish signal, indicating an increase in good momentum. However, if MACD is falling, this is a bearish sign and highlights increasing negative momentum.
MACD can be used to spot areas of price divergence, giving you a trading signal. When the price creates a higher low while MACD produces a lower low, or when the price creates a lower low while MACD generates a higher high, there is a bearish divergence.
A bearish divergence occurs when a price creates a higher high, and the MACD records a lower high or when the price produces a lower high while the MACD records a higher high.
When the price prints a lower low while the MACD records a higher low, it indicates that there will soon be an uptrend change.
2. MYC Trading Indicator
The MYC Trading Indicator is a confidential indicator that combines trend analysis and momentum oscillators to determine when a cryptocurrency will enter a bullish or bearish trend with accuracy.
The trendline is a crucial element of the indicator, which reveals whether or not a long signal will be produced when the price rises, and whether or not a short signal will be printed when the price falls.
MYC, unlike the RSI or Bollinger Bands, not only advises a suggested exit point for traders to focus on, but offers a recommended entry point as well.
3. Relative Strength Index (RSI)
The Relative Strength Index, developed by technical analyst Welles Wilder, helps traders determine when Bitcoin’s price is too far from its “real” value, allowing them to profit before the market corrects itself.
Traders use the Relative Strength Index to identify excellent trading entry points, and over time, it’s shown to be a very valuable tool when trading the volatile cryptocurrency markets.
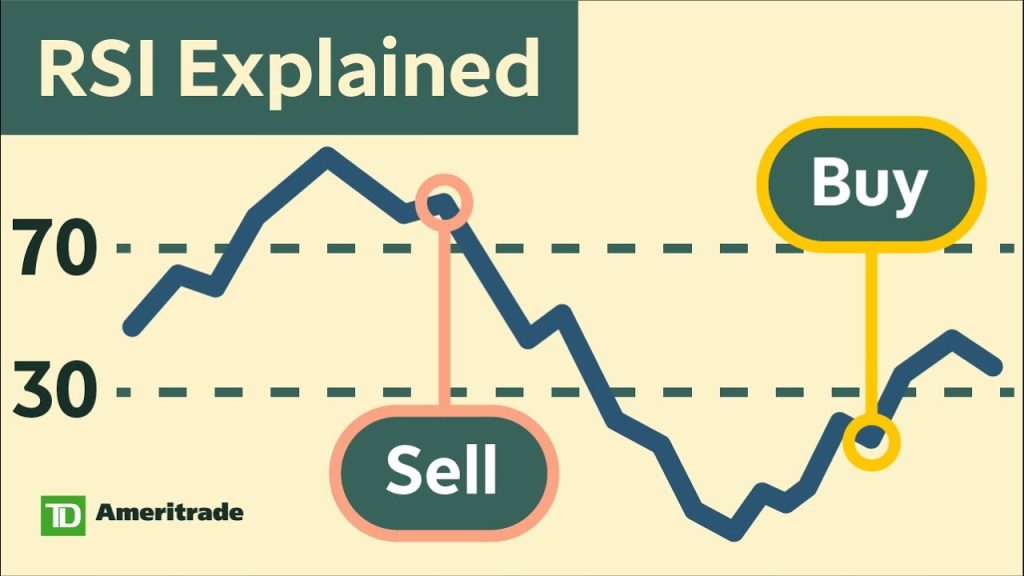
The RSI determines whether Bitcoin is overbought or undervalued based on a complicated formula.
The value ranges from 0 to 100 and may be indicated on the chart using an oscillator, which is essentially a wave pattern.
When an asset cools off for a short time, it’s simple to detect: the chart will enter overbought territory if the RSI is above 70.
4. Bollinger Bands
Bollinger Bands are a popular kind of technical analysis indicator created in the 1980s by John Bollinger, a financial analyst. They’re used by traders for technical analysis and function as an oscillator that measures market volatility.
The basic idea of this Bitcoin indicator is to display how prices are dispersed over a typical value.
The upper band, moving average line, and lower band of Bollinger Bands are designed to show the difference between a market’s high and low extremes. The two outer bands reflect market price fluctuations.
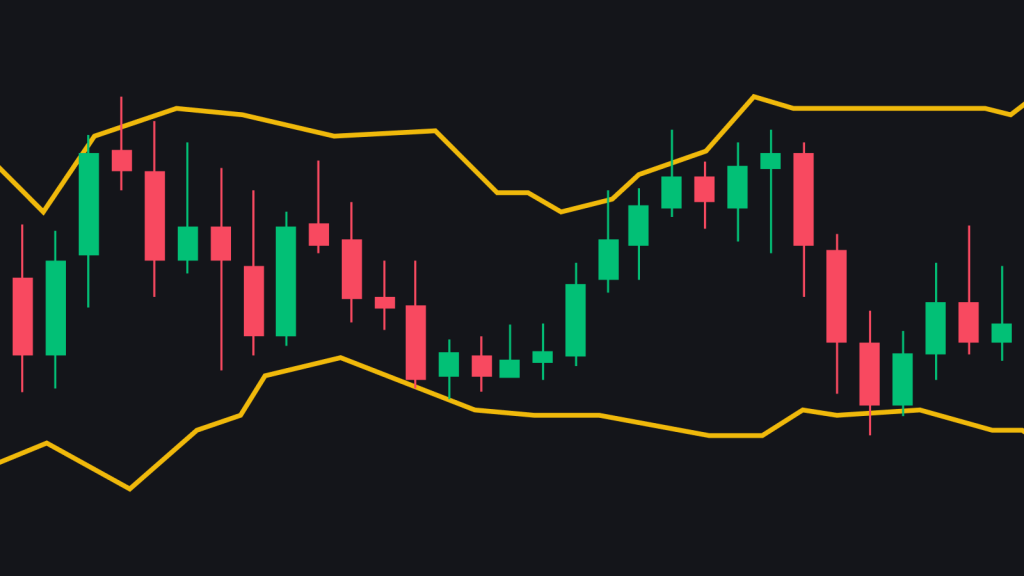
When volatility is high, they expand by moving away from the middle band. When volatility is low, they contract by moving closer to the middle band.
The centerline is set using a 20-day simple moving average (SMA) for the Bollinger Bands. The top and bottom bands are determined by market volatility, just as the upper and lower bands are.
5. Moving Averages (MA)
A Moving Average indicator is a form of smoothing used in the Bitcoin market. The moving average (MA) is a lagging indicator, which means that it takes into account price movements from prior days.
The moving average is used to find trends and predict price movements.
There are two sorts of moving averages: simple and exponential.
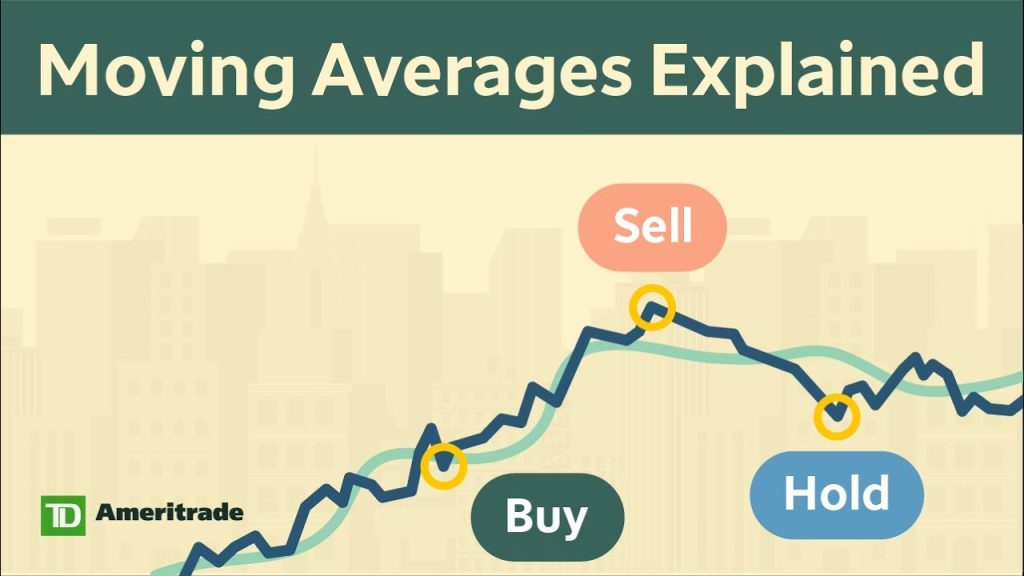
The MA you choose depends on your trading style; if you’re a short-term trader, for example, a shorter one would be more beneficial to you. Moving averages act as supports or resistances in the markets.
The two most popular measures of the trend are MACD and its variants. Trend definition is straightforward for MAs since they can assist us in identifying a trend.
When the MA slopes upwards, it implies that the asset is moving upward at price. However, if the MA slopes downwards, this indicates that the asset you’re looking at is declining in value.
In Summary
As you’ve seen, there are a variety of crypto indicators in use today, each tracking different data points with the intention of providing a different predictive model. No crypto indicator is perfect, but many can get you closer to a clearer understanding of what the future may hold.
If you want to earn a nice bonus and also save money every time you shop online, here’s how:
- Sign up with TopCashback, a cashback portal currently offering a $15 signup bonus that’s extremely easy to get.
- The average TopCashback user saves $450/year, with savings of up to 30% on fashion, 40% on cosmetics and beauty, 50% on travel, and much more.
Best Indicators For Crypto Trading FAQs
What Are Crypto Indicators?
Crypto indicators are technical indicators that traders use to predict market movements. Crypto indicators are often used to display patterns of price activity, and by following these patterns, traders can develop their own trading strategies.
Crypto indicators are also utilized to keep up with news and changes in other markets (e.g. the gold market, forex markets, the Ethereum market, etc.) that could influence the price of the cryptocurrency you’re trading.
What Are The Best Indicators For Technical Analysis In Crypto?
Analyzing an asset’s price movement based on past market prices and volume is known as technical analysis. Some extremely useful technical analysis signals may be used to improve your chances of success.
What’s The Best Crypto Trading Strategy?
The best crypto trading strategy is the one that works for your situation and personality. Some crypto investors appreciate the simplicity of the Relative Strength Index (RSI) and the MYC, while others prefer having more information at their fingertips, which is offered by indicators like the Moving Average Convergence/Divergence (MACD).
Is MACD Good For Crypto?
Yes, MACD indicators can be extremely helpful when trading crypto, since the MACD gives traders a clear understanding of long- and short-term price momentum. However, keep in mind that the MACD lacks an absolute range, so it’s not helpful in determining overbought or oversold scenarios.
Is RSI A Good Indicator For Crypto?
Yes, RSI can be strong indicators for trading crypto, but only if you know how to read them. The RSI helps traders recognize when a crypto asset is overvalued or undervalued based on a 100-point scale, though it lacks predictive power.